Measurement
Social scheduling measurement with five evidence layers kept separate
Measure social scheduling with explicit metric cards, separate operational and outcome evidence, bounded attribution, uncertainty and decision-led reporting.
Social media scheduling measurement should answer a decision, not decorate a monthly report. Start by asking whether the publishing operation worked as specified, what the platform recorded, whether an eligible audience completed an intended action and what evidence connects that action to the scheduled activity. Those are different questions.
For an organisation operating in England, no platform export automatically describes England or proves commercial impact. Geography may reflect a profile field, device inference, account setting or nothing usable at all. Keep the supplier's population and method beside every value. If England cannot be identified defensibly, label the result by its true scope.
This guide contains no benchmark, campaign result or legal conclusion. It is a reporting design for qualified statistical, evaluation, data-protection, PECR, advertising and finance review before publication or operational use.
What to take away
- Keep operational, platform, outcome, financial and attribution evidence in separate layers rather than one score.
- A metric card needs the exact event, population, numerator, denominator, unit, period, source and owner.
- Platform counts such as LinkedIn impressions are supplier estimates under dated definitions, not England rates.
- Tracking permission is a separate gate from measurement usefulness and needs its own documented review.
- Use observed, credited under model, associated or estimated causal effect deliberately, never generated.
Separate five layers of evidence
Begin the report with the layer that generated each measure.
Five evidence layers, kept separate
- Operational output records: scheduled, released, corrected
- Audience and platform records: displays, reactions, clicks
- Outcome records: eligible completed enquiry
- Financial or value records: contribution and full cost
- Attribution records: credit allocated, not causation
- Operational output records show whether approved items were scheduled, released, monitored, corrected or withdrawn.
- Audience and platform records show events under a supplier's current definitions, such as displays, reactions or clicks.
- Outcome records show events in an organisation's own service, such as an eligible completed enquiry.
- Financial or value records express observed contribution and full cost under a stated model.
- Attribution records allocate credit. Impact evaluation asks the harder causal question of what changed because of the activity.
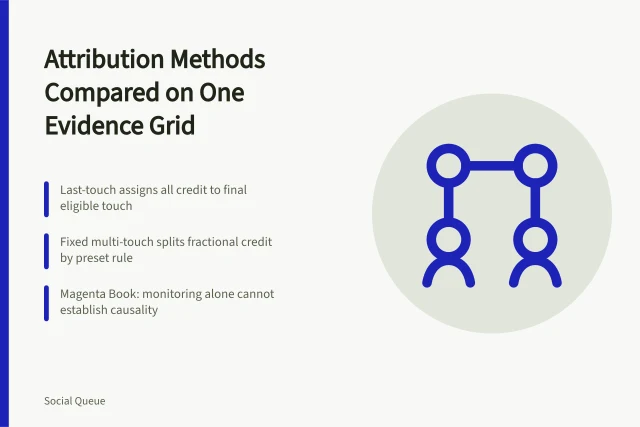
HM Treasury's 2026 Magenta Book distinguishes process, impact and value-for-money evaluation. Monitoring can show what happened while an intervention was delivered. It does not, on its own, establish that the intervention caused the observed outcome.
Do not combine the layers into a single performance score. An item may be published exactly as approved while attracting no recorded action. A platform may report many displays even though the destination system records no eligible outcome. Both findings can be accurate within their own definitions.
Give every measure a complete metric card
A label such as engagement is too loose. The card needs an exact event, eligible population, numerator, denominator, unit, date range, timezone, exclusions, source system, query or export version, owner and known uncertainty. Counts have no denominator, but the card should say not applicable rather than leaving the field blank.
Fields every metric card needs
- Exact event and eligible population
- Numerator, denominator, unit
- Date range and timezone
- Exclusions and source system
- Query or export version
- Owner and known uncertainty
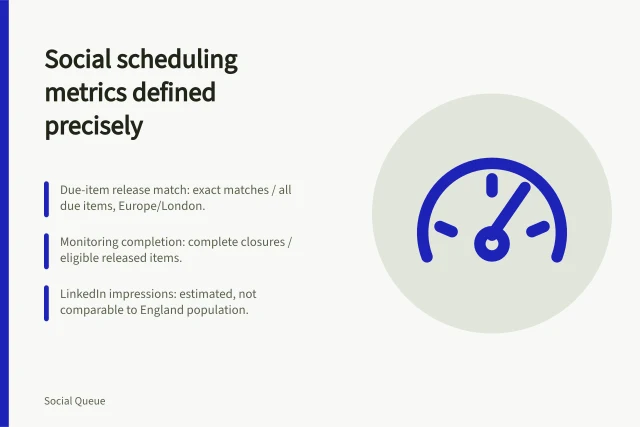
Operational card: approved-release match rate
- Event
- a live item matches the approved revision, account, audience and scheduled object.
- Population
- all eligible items due for release in the reporting period.
- Numerator
- eligible items verified as exact matches.
- Denominator
- all eligible due items, including failed or missing releases.
- Unit
- percentage, plus numerator and denominator.
- Period and timezone
- stated dates using Europe/London.
- Exclusions
- items withdrawn before the due time, reported in a separate count.
- Source
- approval register, scheduling log and dated live capture.
- Owner and uncertainty
- operations analyst; missing captures and platform timestamp differences are disclosed.
The blank formula is approved-release match rate = verified exact matches / eligible due items x 100. It becomes a result only after real records are entered.
Platform card: LinkedIn Page impressions
- Event
- an impression under the LinkedIn Page content-analytics definition current when exported.
- Population
- posts, audience settings and organic or sponsored scope included in the export.
- Numerator
- not applicable; this is a supplier-reported count.
- Denominator
- not applicable.
- Unit
- estimated impressions.
- Period and timezone
- export range and the account or supplier timezone, recorded explicitly.
- Exclusions
- unavailable, suppressed or differently surfaced activity as documented for that export.
- Source
- exact export plus definition-page capture.
- Owner and uncertainty
- reporting analyst; supplier estimation and later data changes remain visible.
LinkedIn's current content analytics record calls impressions an estimate, defines member reach differently and warns that Page analytics and Campaign Manager may not share the same coverage. That product page was checked on 6 September 2026. It supports LinkedIn definitions only, not an England rate or cross-platform comparison.
Outcome card: eligible enquiry completion rate
- Event
- a destination-system record reaches the organisation's pre-defined valid-enquiry state.
- Population
- eligible sessions arriving through included, tagged scheduled posts.
- Numerator
- valid enquiries within the stated outcome window.
- Denominator
- eligible tagged sessions in the same population.
- Unit
- percentage, with both underlying counts.
- Period and timezone
- fixed cohort entry dates and Europe/London outcome cut-off.
- Exclusions
- staff tests, duplicates, bots under the stated rule, untagged traffic and records unavailable because of lawful measurement choices.
- Source
- versioned destination query joined to a governed campaign-key table.
- Owner and uncertainty
- service analyst; identity loss, device changes and missing consent reduce coverage.
This is an observed association within the tagged population. It is not a causal conversion lift.
Treat tracking permission as a separate gate
Measurement tags, pixels and link decoration can involve storage or access on a device and processing of identifiers. The ICO finalised its storage and access technologies guidance on 29 April 2026. It covers analytics and advertising measurement, with specific questions about PECR exceptions and UK GDPR interaction.
The reporting plan should list each technology, purpose, operator, information accessed, recipient, retention and user control. A useful metric does not create legal permission. Nor should the analyst fill measurement gaps with modelled values unless the model, inputs, assumptions and uncertainty are approved and disclosed.
Build the dashboard around decisions
A compact dashboard can use four panels. The delivery panel covers due items, exact-release matches, failed jobs and unresolved monitoring. The platform panel holds product-specific counts under dated definitions. The outcome panel uses the organisation's own eligible events. The evidence panel states missing data, definition changes, revisions and attribution strength.
Four dashboard panels
Panel
- Delivery
- Due items, exact matches, failures
- Platform
- Product counts, dated definitions
- Outcome
- Own eligible events
- Evidence
- Missing data, revisions, attribution strength
What it holds
- Delivery
- Platform
- Outcome
- Evidence
Each chart needs its population, period, timezone and source close to the values. The Government Analysis Function's guidance on quality, uncertainty and change advises producers to explain sources, definitions, bias, adjustments and uncertainty. It was written for official statistics but offers a strong discipline for internal reporting.
Show current and prior values only when definitions and coverage are comparable. Mark a break in series when a platform changes an event rule, export, attribution window or reporting surface. Do not quietly backfill one supplier definition into another.
Choose attribution language that matches the method
Rule-based attribution assigns credit according to a declared convention. It can help reconcile reports, but another rule can allocate the same outcomes differently. A supplier model is also a model, even when it has a polished interface.
Attribution language by method
Method
- Rule-based model
- Credited under model
- Observational comparison
- Associated
- Controlled experiment
- Estimated causal effect
- Raw monitoring
- Observed
Allowed wording
- Rule-based model
- Observational comparison
- Controlled experiment
- Raw monitoring
Google's Analytics attribution overview defines attribution as assigning credit and documents current product models and exclusions. It was checked on 6 September 2026. Use its record only for the named product and configuration. Save model, reporting-time basis, channels, outcome event, lookback settings and extraction date with the result.
Observational comparison can examine differences between exposed and unexposed records, but selection and other changes may explain them. A controlled experiment or defensible quasi-experimental design can support a causal estimate if its assumptions hold. HM Treasury's Quality in policy impact evaluation says monitoring an outcome does not show that an intervention caused it and places weight on a credible counterfactual.
The report should use observed, credited under model, associated or estimated causal effect deliberately. Never replace all four with generated.
Keep value measures separate from activity
An outcome count is not revenue, and revenue is not contribution. Define any value calculation from governed finance records. One blank project formula is:
attributed contribution ratio = observed contribution credited under the named model / [full economic](/social-media-scheduling-business-models-in-england) cost of the measured activity
The numerator needs currency, period, recognised outcome, contribution rule, reversals and attribution model. The denominator needs supplier cash, paid distribution, labour, creative, assurance, measurement, support and recovery costs for the same period. A finance owner approves both. The ratio remains attribution-based unless a credible impact design estimates incremental contribution.
The 2026 Green Book is mandatory for relevant UK central-government appraisal, not a private-company ROI calculator. Its broader lesson is that a single monetised summary cannot replace objectives, non-monetised effects, risks, uncertainty and distributional considerations.
Research benchmarks before adopting them
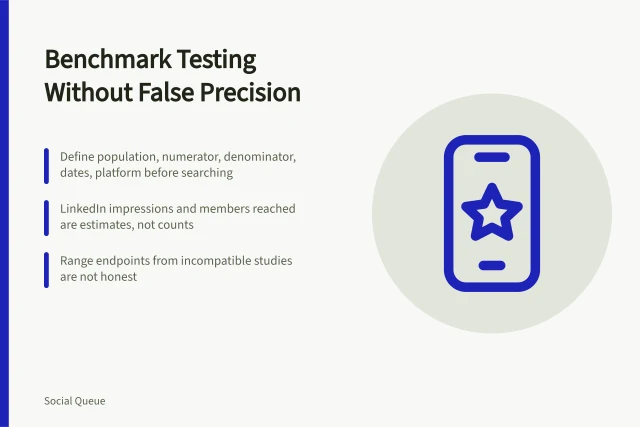
An external rate is comparable only if event, population, numerator, denominator, unit, geography, period, platform surface, paid or organic status and collection method match. ONS describes quality as fitness for purpose, including relevance, accuracy, timeliness, clarity, coherence and comparability.
No source reviewed for this cluster supplies a defensible England-wide social-scheduling benchmark. That evidence gap should remain visible. A UK figure cannot be relabelled England, and a vendor dataset cannot describe all organisations unless its sampling and coverage warrant that claim.
Build a local reference distribution instead. Freeze the metric card, collect a stated period, preserve missingness and segment only where sample size and privacy controls permit. Use the distribution to spot unusual operational changes, not as a universal target.
Turn the report into controlled decisions
Every panel should state the decision owner and trigger. An operational mismatch can pause releases. A definition change can suspend comparison. A privacy concern can disable a measurement route. Weak attribution can block an investment claim. None of these decisions requires an invented red, amber or green threshold.
At each reporting close, preserve the metric-card version, extraction time, source files, query, adjustments, exclusions and reviewer. Record revisions rather than replacing the old result. The next practical step is to choose one decision and complete one metric card. If the event, population or denominator cannot be written plainly, the measure is not ready for a dashboard.
Before you act
- Name the decision the report must answer.
- Label each measure with its true scope.
- Record the supplier definition and export date.
- State the population, period and timezone.
- Mark a break in series when definitions change.
- Disclose missing data and known uncertainty.
Common questions
Why should the five evidence layers stay separate?
Each layer answers a different question. Operational records show whether publishing worked as specified, platform records show supplier-defined events, outcome records show events in the organisation's own service, financial records express contribution and cost, and attribution records allocate credit. Combining them into one performance score hides those differences and can make accurate findings look contradictory.
What belongs on a complete metric card?
The card needs an exact event, eligible population, numerator, denominator, unit, date range, timezone, exclusions, source system, query or export version, owner and known uncertainty. Counts have no denominator, so the card should say not applicable rather than leave the field blank. A loose label such as engagement is not enough.
When can a report claim a causal effect?
Monitoring an outcome does not show that an intervention caused it. Observational comparison can be explained by selection and other changes. A controlled experiment or defensible quasi-experimental design can support a causal estimate if its assumptions hold, and HM Treasury guidance places weight on a credible counterfactual.
In this guide
- Five social scheduling metrics defined down to timezone, exclusions and uncertaintyDefine social scheduling metrics for England with complete event, population, denominator, period, timezone, source, exclusion and uncertainty fields.
- A four-panel social scheduling dashboard that keeps the platform boundary visibleBuild a social scheduling dashboard that preserves metric definitions, platform scope, missing data, uncertainty, attribution strength and decision ownership.
- Social media scheduling attribution methods compared on one evidence gridCompare social scheduling attribution methods on one evidence grid, separating assigned credit, observed association and causal estimates without a winner.
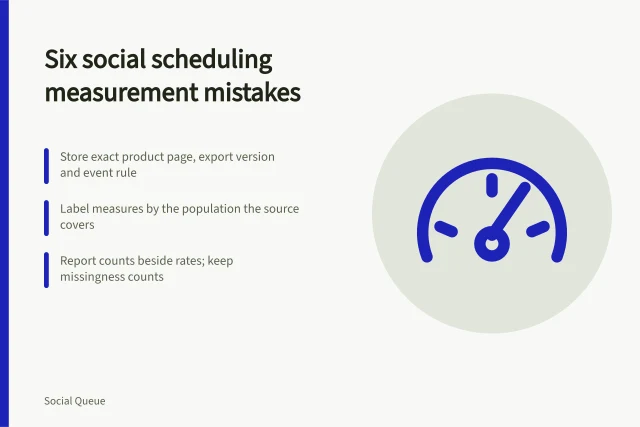
- Six social scheduling measurement mistakes, from lost definitions to attribution called causeA dated, non-ranked list of social scheduling measurement mistakes, with official evidence on definitions, comparability, uncertainty, privacy and causality.
- Testing a social scheduling benchmark for population, definitions and false precisionResearch social scheduling benchmarks without inventing thresholds by testing population, geography, definitions, periods, methods, bias and comparability.