Measurement
Part of Social scheduling measurement with five evidence layers kept separate
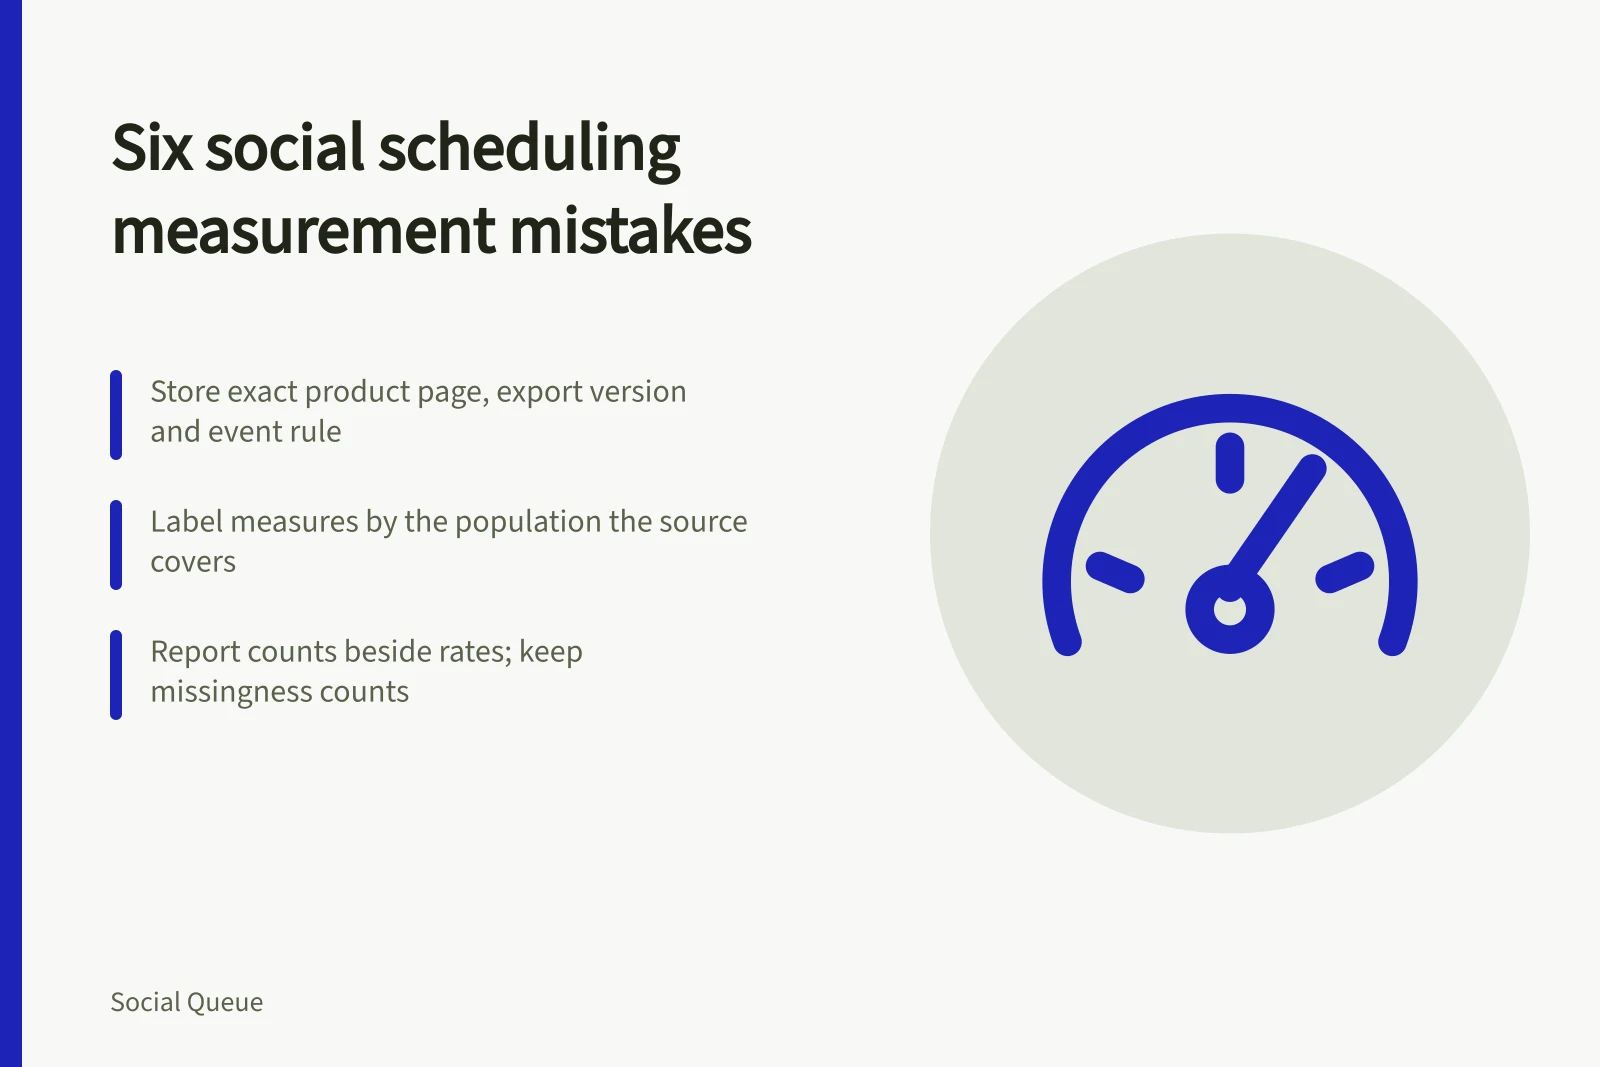
Six social scheduling measurement mistakes, from lost definitions to attribution called cause
A dated, non-ranked list of social scheduling measurement mistakes, with official evidence on definitions, comparability, uncertainty, privacy and causality.
These social media scheduling measurement mistakes can make a tidy report support the wrong decision.
Method: reviewed the reporting chain from platform event to investment claim against current UK official methods and one supplier definition record. Research date: 6 September 2026. Scope: organisations operating from England, with UK and global-product evidence labelled. Inclusions: definition, geography, missingness, comparison, attribution and privacy failures. Exclusions: invented results, sector rankings and product testing. Ranking: non-ranked. Conflicts: no supplier or agency funded this work.
What to take away
- Store the exact product page, export version and event rule because a familiar label cannot replace them.
- Label any measure by the population its source actually covers, and state when geography is absent.
- Report both counts beside a rate, since an unexplained fall may reflect a changed denominator.
- Keep a missingness count and reason, because removing records can improve a displayed rate.
- Treat attribution rules as allocating credit, not as creating a counterfactual for cause.
1. Keeping the label but losing the definition
An impression or engagement is not portable between products, surfaces or dates. LinkedIn's content analytics record, checked on the research date, describes impressions as estimates and defines its own engagement components. Store the exact product page, export version and event rule. A familiar label cannot replace them.
2. Calling UK or unknown geography England
Profile locations, campaign settings and business addresses are different populations. ONS defines quality partly through relevance, coherence and comparability across geography and time. Label the measure by the population the source actually covers. If geography is absent, say so.
3. Publishing a rate without its parts
A percentage needs an event, eligible population, numerator, denominator, unit, period, timezone, exclusions and source. Report both counts beside the rate. An unexplained fall might reflect a changed denominator or missing feed rather than behaviour.
The Government Analysis Function's Aqua Book record describes quality assurance for government analysis. An internal commercial report is outside its mandatory scope, but the discipline of documented and reviewed analysis is still useful.
4. Hiding missing observations
Removing untagged sessions, failed joins or privacy-limited records can improve a displayed rate by shrinking the denominator. Keep a missingness count and reason. The Government Analysis Function advises clear explanation of sources, bias, definitions and adjustments in its uncertainty guidance.
5. Treating attribution as cause
A last-touch or multi-touch rule allocates credit. It does not create a counterfactual. HM Treasury's QPIE guidance distinguishes monitoring an outcome from showing that an intervention caused it. Use credited, associated or estimated causal effect according to the design.
6. Collecting extra data because the chart has gaps
Pixels, link decoration and advertising measurement can raise PECR and UK GDPR questions. The ICO finalised its storage and access guidance in April 2026. A qualified practitioner should assess the actual technology and purpose. Reporting convenience is not permission.
7. Comparing across a silent series break
Platform definitions, queries, attribution windows and coverage change. Mark the effective date, preserve the old metric version and stop trend comparison where the two sides are incompatible. The Code of Practice for Statistics applies to official statistics, but its focus on suitable sources, methods and transparent limitations provides a useful voluntary standard.
8. Letting dashboard edits bypass review
A renamed field, altered filter or revised join can change reported population without changing the chart title. Treat metric register and query as controlled versions.
The Government Analysis Function's Aqua Book record identifies quality assurance in producing analysis. Require another analyst to reproduce a material revision from saved source and instructions before replacing the prior result.
Assign each mistake an evidence owner and repair. The repair may be a revised query, a restated population, a break marker or withdrawal of a claim. Do not solve a weak measure by inventing a threshold.
Before you act
- Record the product page, export version and event rule.
- State the population the source actually covers.
- Report counts beside every published rate.
- Keep a missingness count with its reason.
- Mark the effective date of any series break.
- Require another analyst to reproduce material revisions.
Common questions
Why is a familiar metric label not enough on its own?
An impression or engagement is not portable between products, surfaces or dates. LinkedIn's content analytics record describes impressions as estimates and defines its own engagement components. Store the exact product page, export version and event rule, because a familiar label cannot replace them.
What should accompany a published percentage?
A percentage needs an event, eligible population, numerator, denominator, unit, period, timezone, exclusions and source. Report both counts beside the rate. An unexplained fall might reflect a changed denominator or missing feed rather than behaviour.
Does an attribution rule show that social activity caused an outcome?
No. A last-touch or multi-touch rule allocates credit, but it does not create a counterfactual. HM Treasury's QPIE guidance distinguishes monitoring an outcome from showing that an intervention caused it. Use credited, associated or estimated causal effect according to the design.