Measurement
Part of Social scheduling measurement with five evidence layers kept separate
A four-panel social scheduling dashboard that keeps the platform boundary visible
Build a social scheduling dashboard that preserves metric definitions, platform scope, missing data, uncertainty, attribution strength and decision ownership.
A social media scheduling reporting dashboard should show what decision a measure supports and whether the evidence is fit for that use. Begin with a metric register. Do not begin with chart colours.
What to take away
- Start with a metric register that records event, population, numerator, denominator, owner and uncertainty before choosing chart colours.
- Use four panels for delivery, platform observations, destination outcomes and evidence, and avoid a blended score.
- Keep the platform boundary visible by retaining supplier wording and never mixing one platform's denominator with another's rate.
- Mark any change in event rule, surface, query, coverage or attribution window as a series break.
- Each panel needs an owner, permitted action and review trigger, and the metric version must be archived at close.
Create the metric register
Give each measure a stable identifier and version. The record contains the exact event, eligible population, numerator, denominator, unit, date range, timezone, exclusions, source system, query or export, owner and uncertainty. It also says whether the value is an operational observation, supplier-reported platform value, internal outcome, financial measure or attribution output.
Metric register fields
- OPS-RELEASE-MATCHstable identifier
- Exact matches / eligible due itemsformula
- Europe/Londontimezone
- Operations analystowner
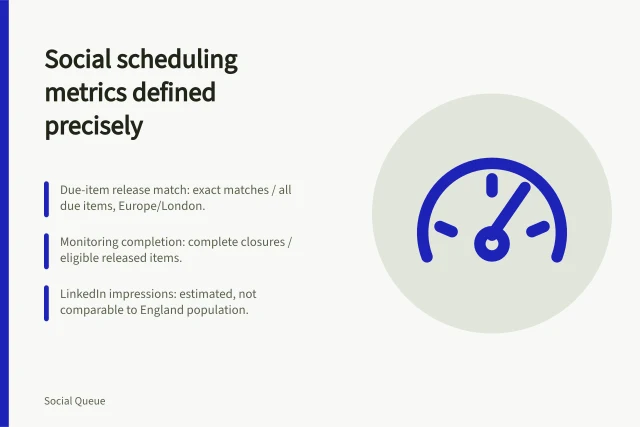
Define OPS-RELEASE-MATCH as the live item matching the approved revision. The population is all items due in the report period. The numerator is exact matches; the denominator is all due items. The unit is a percentage with counts.
Dates use Europe/London. Formal pre-release withdrawals are excluded and counted separately. Sources are approval, schedule and live-capture records. The operations analyst owns the query; missing captures are uncertainty.
Blank formula: OPS-RELEASE-MATCH = exact live matches / eligible due items x 100.
Use four panels
The first panel covers delivery. Show eligible due items, match status, monitoring completion and unresolved defects. The second holds platform observations, each labelled with product, surface, export date and supplier definition. The third contains destination outcomes from the organisation's governed systems. The fourth is an evidence panel for missingness, revisions, definition breaks and attribution strength.
Four dashboard panels
Panel
- Delivery
- Eligible due items
- Platform observations
- Product
- Destination outcomes
- Governed systems
- Evidence
- Missingness
Contents
- Delivery
- Match status
- Platform observations
- Surface
- Destination outcomes
- Internal outcomes
- Evidence
- Revisions
Owner
- Delivery
- Monitoring completion
- Platform observations
- Export date
- Destination outcomes
- No blended score
- Evidence
- Attribution strength
Avoid a blended score. A failed approval match is an operational defect even if platform response looks favourable. A high supplier count cannot cancel a privacy or evidence failure.
ONS defines statistical quality through fitness for purpose, including relevance, accuracy, timeliness, clarity, coherence and comparability. An internal dashboard is not official statistics, but these dimensions expose weak joins and misleading comparisons.
Preserve the platform boundary
If a supplier reports impressions, reach or interactions, retain its wording. Note organic or paid scope, account, audience, timezone, processing delay and export version. Never use one platform's denominator to calculate another platform's rate.
The LinkedIn content analytics page, checked on 6 September 2026, calls impressions and members reached estimates and defines its engagement-rate components. That is a dated product record, not a general definition and not an England benchmark.
Expose missing data and privacy choices
The dashboard should show unavailable records, rejected joins, untagged traffic and data intentionally not collected. The ICO's storage and access technologies guidance was finalised in April 2026 and includes analytics and advertising-measurement questions. A qualified reviewer must assess the actual tags, identifiers, purposes and controls. Measurement convenience does not override that gate.
Make change readable
Put the current value beside its numerator, denominator and prior comparable period. Mark any change in event rule, platform surface, query, coverage or attribution window as a series break. Do not present a percentage movement where either period has incompatible definitions.
The Government Analysis Function's uncertainty guidance recommends explaining data sources, bias, definitions, adjustments and what users can and cannot conclude. Put the material limitation next to the chart, not behind a tooltip nobody opens.
Attach decisions and review triggers
Each panel names an owner, permitted action and trigger for review. A release mismatch can pause scheduling. A supplier-definition change can suspend comparison. A broken outcome join can prevent value reporting. Weak attribution can block causal wording.
At close, archive the metric version, source extracts, query, access controls, adjustments and sign-off. A dashboard screenshot is not enough to reproduce a figure. Re-run quality assurance after a platform change, source migration, privacy decision or unexplained discontinuity.
Before you act
- Write the metric register before designing any chart.
- Label every platform observation with product, surface, export date and supplier definition.
- Show unavailable records, rejected joins, untagged traffic and data not collected.
- Place the material limitation next to the chart, not in a tooltip.
- Name an owner, permitted action and review trigger for each panel.
- Archive the metric version, extracts, query, controls, adjustments and sign-off.
Common questions
What should a metric register contain?
Each measure gets a stable identifier and version. The record holds the exact event, eligible population, numerator, denominator, unit, date range, timezone, exclusions, source system, query or export, owner and uncertainty. It also states whether the value is an operational observation, supplier-reported platform value, internal outcome, financial measure or attribution output.
Why should a dashboard avoid a blended score?
A failed approval match is an operational defect even if platform response looks favourable. A high supplier count cannot cancel a privacy or evidence failure. Keeping delivery, platform observations, destination outcomes and evidence in separate panels stops one strong number hiding a weak join or a definition break.
What should happen when a platform changes?
Re-run quality assurance after a platform change, source migration, privacy decision or unexplained discontinuity. Mark any change in event rule, platform surface, query, coverage or attribution window as a series break. A supplier-definition change can suspend comparison, and a broken outcome join can prevent value reporting.